Porto Pyramids (Egypt)
General Information
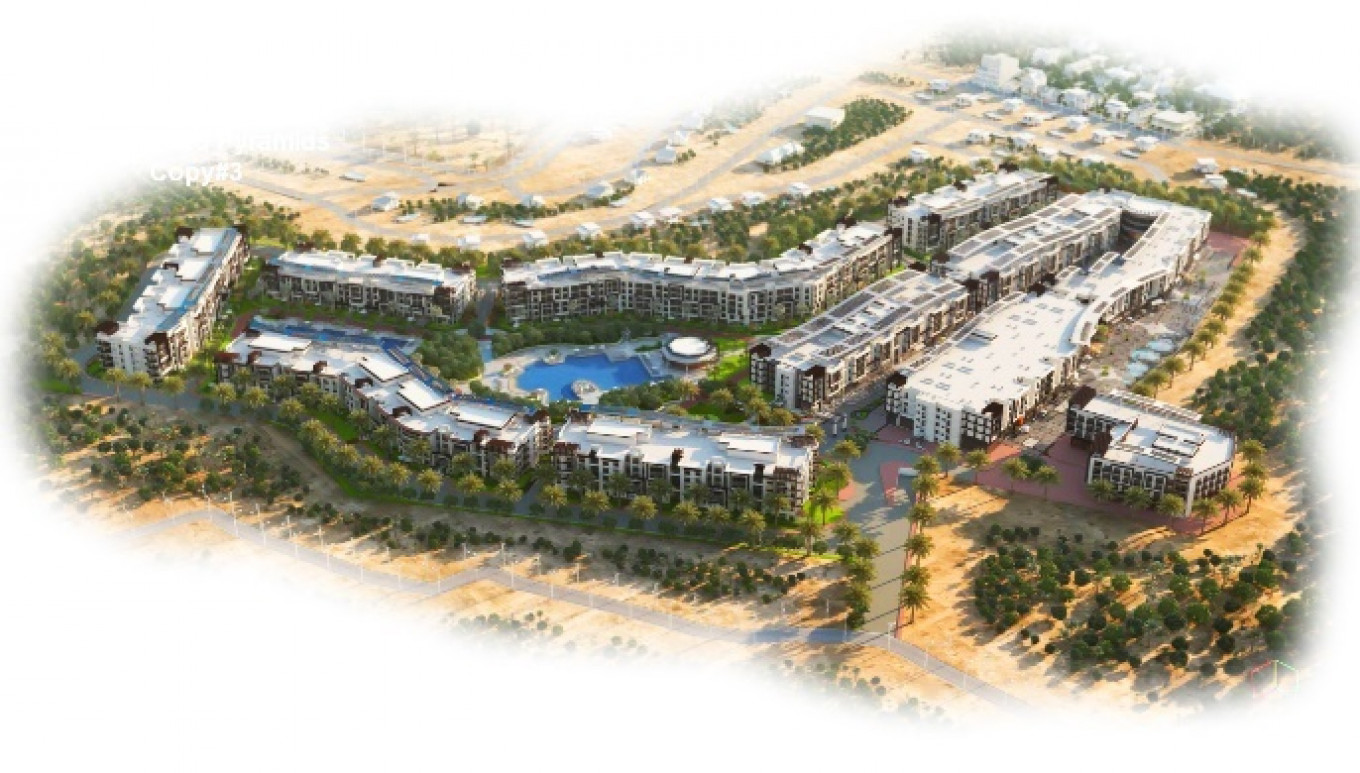
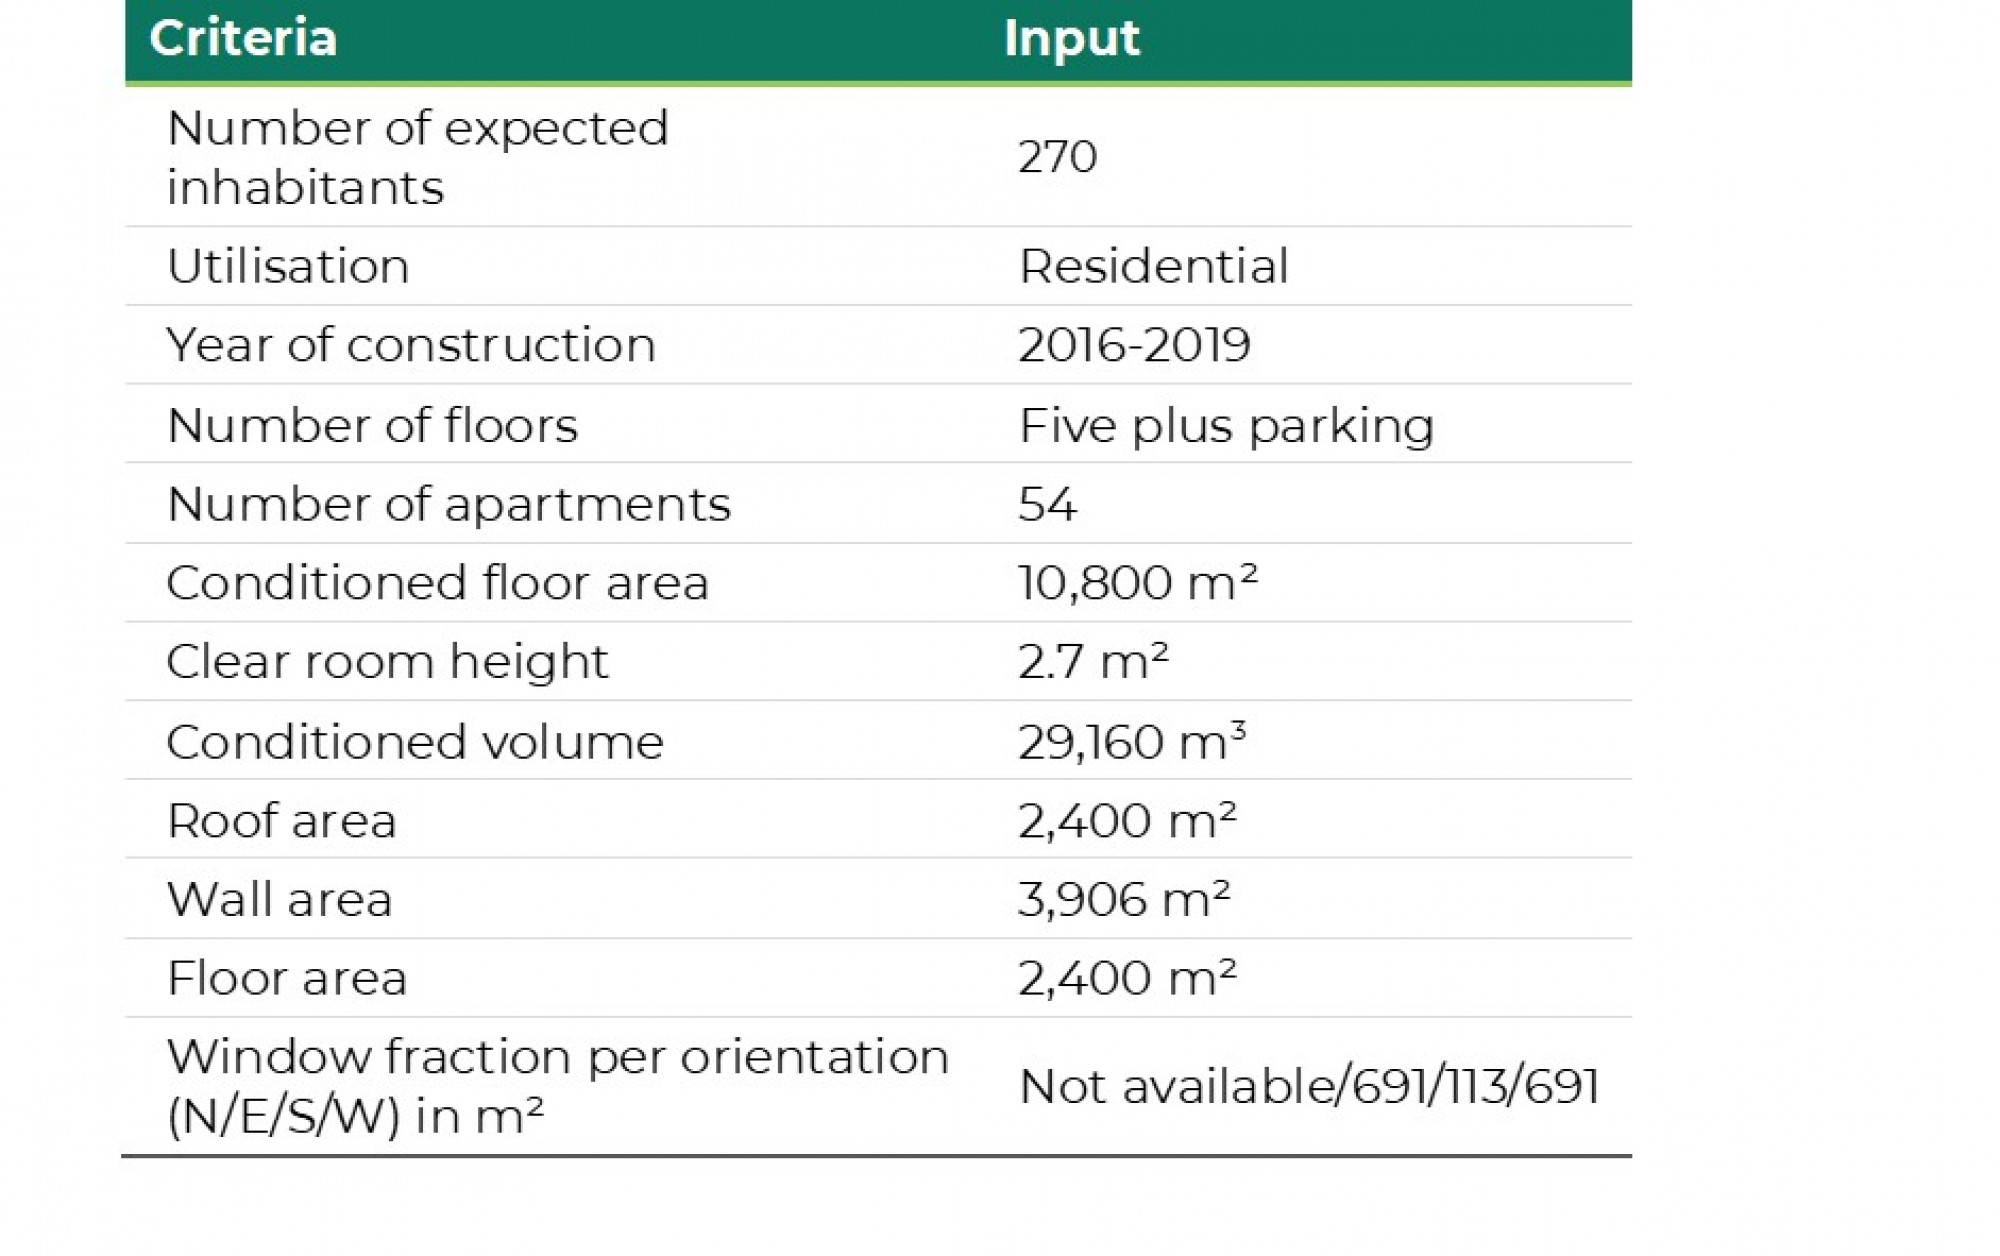
The Porto Group operates as one of the largest privately held corporations in Egypt as an established leader in the hospitality industry and one of the largest resort developers. Porto Group launched the new development project Porto Pyramids in 2016. This project is already in the construction phase, located ~18 km from Cairo, North Egypt. The master plan includes 16 unit types, a 5-star hotel, a spa and gym, swimming pools, and a club house. The project site is located close to major businesses and shopping centres, enabling short commutes. The total plot area of the site is about 100.000 m². The selected pilot within this area is a residential multifamily house with 10.800 m² conditioned floor area that includes 54 apartments to serve 270 expected residents.
The external temperatures range from more than zero to 41°C with average annual temperature of around 24°C. December is the coldest month; July is the hottest. The minimum temperature does not fall to less than 0°C. There is greater energy demand for cooling than heating, with more than 1,800 cooling degree days compared with the 290 heating degree days. In Cairo, there is big potential for renewable energy within solar irradiation. Horizontal irradiation of 1,914 kWh/(m²*a) and more than 1000 kWh/(m²*a) for east, south, and west orientation create opportunities for energy generation through solar radiation and solar cooling.
The mean energy prices are EGP 0.13 per kWh (EUR 0.01-0.06 per kWh) for electricity and EGP 3.65-6.6 per kWh (EUR 0.168-0.3 per kWh) for oil. For Egypt, two energy price scenarios have been calculated, as removal of energy price subsidies is planned in coming years.
Baseline and Current Situation
The baseline situation reflects the usual business construction practice in a respective country. It deviates from the available building codes, as major players in the construction practice don´t always respect building codes. In Egypt, the key components of a baseline energy concept are a split unit supplying heating and cooling with a Coefficient of Performance (COP) of 2.5; hot water is supplied by an electric instantaneous appliance. No thermal insulation or renewable energy sources are considered for a baseline project, as the following table illustrates.
This approach results in the following energy breakdown: cooling energy represents the largest portion of the demand with a total of 70.5%, the heating demand reaches 13.9% of the total demand, and the smallest shares are domestic hot water and lighting with 4.9% and 4.8%, respectively. This demand results in energy consumption of 94.1 kWh/(m²*a) and an environmental impact of 62 kg CO2e/(m²*a). Depending on the energy tariff, the square meter will range between EGP 20.4/(m²*a) and EGP 61.3/(m²*a) or between EUR 0.9/(m²*a) and EUR 2.8/(m²*a).
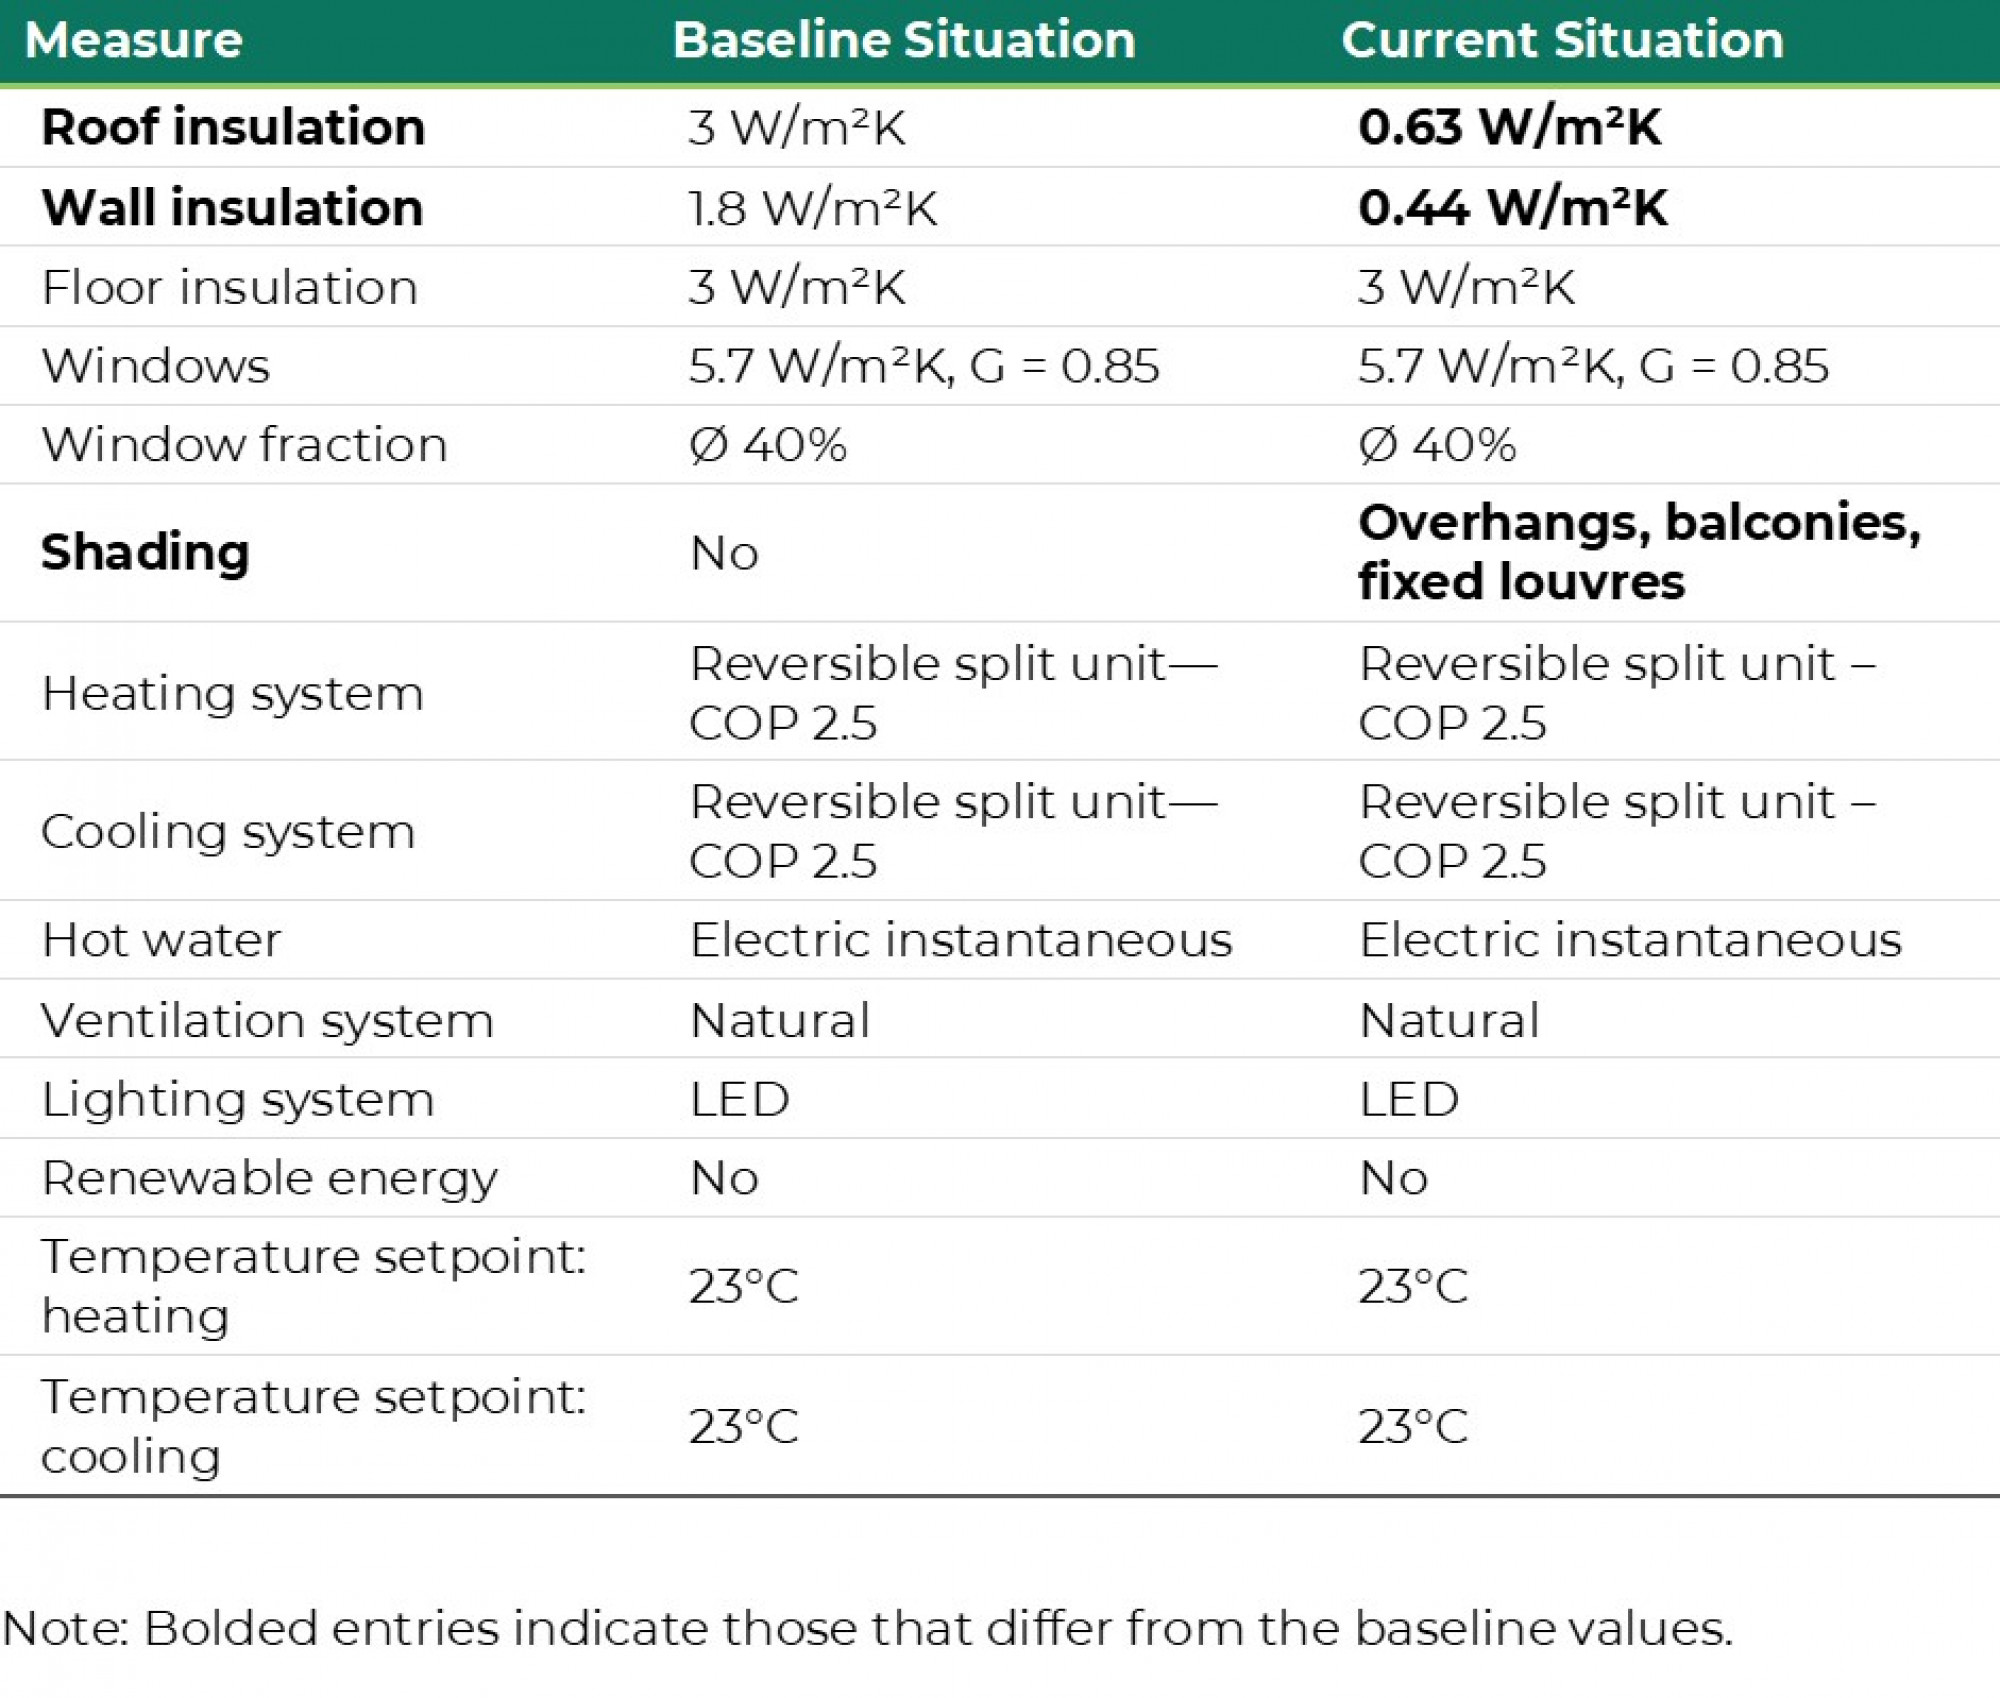
To improve on the baseline approach, the following current planning was shared with the Porto Pyramids BUILD_ME project: use of thermal insulation in the roof and external walls to reduce thermal losses and use of overhangs, balconies, and fixed louvres to reduce solar gains (see bold marked measures in the following table’s Current Situation column).
Variants
Technical description – Variant 1 | Low Investment
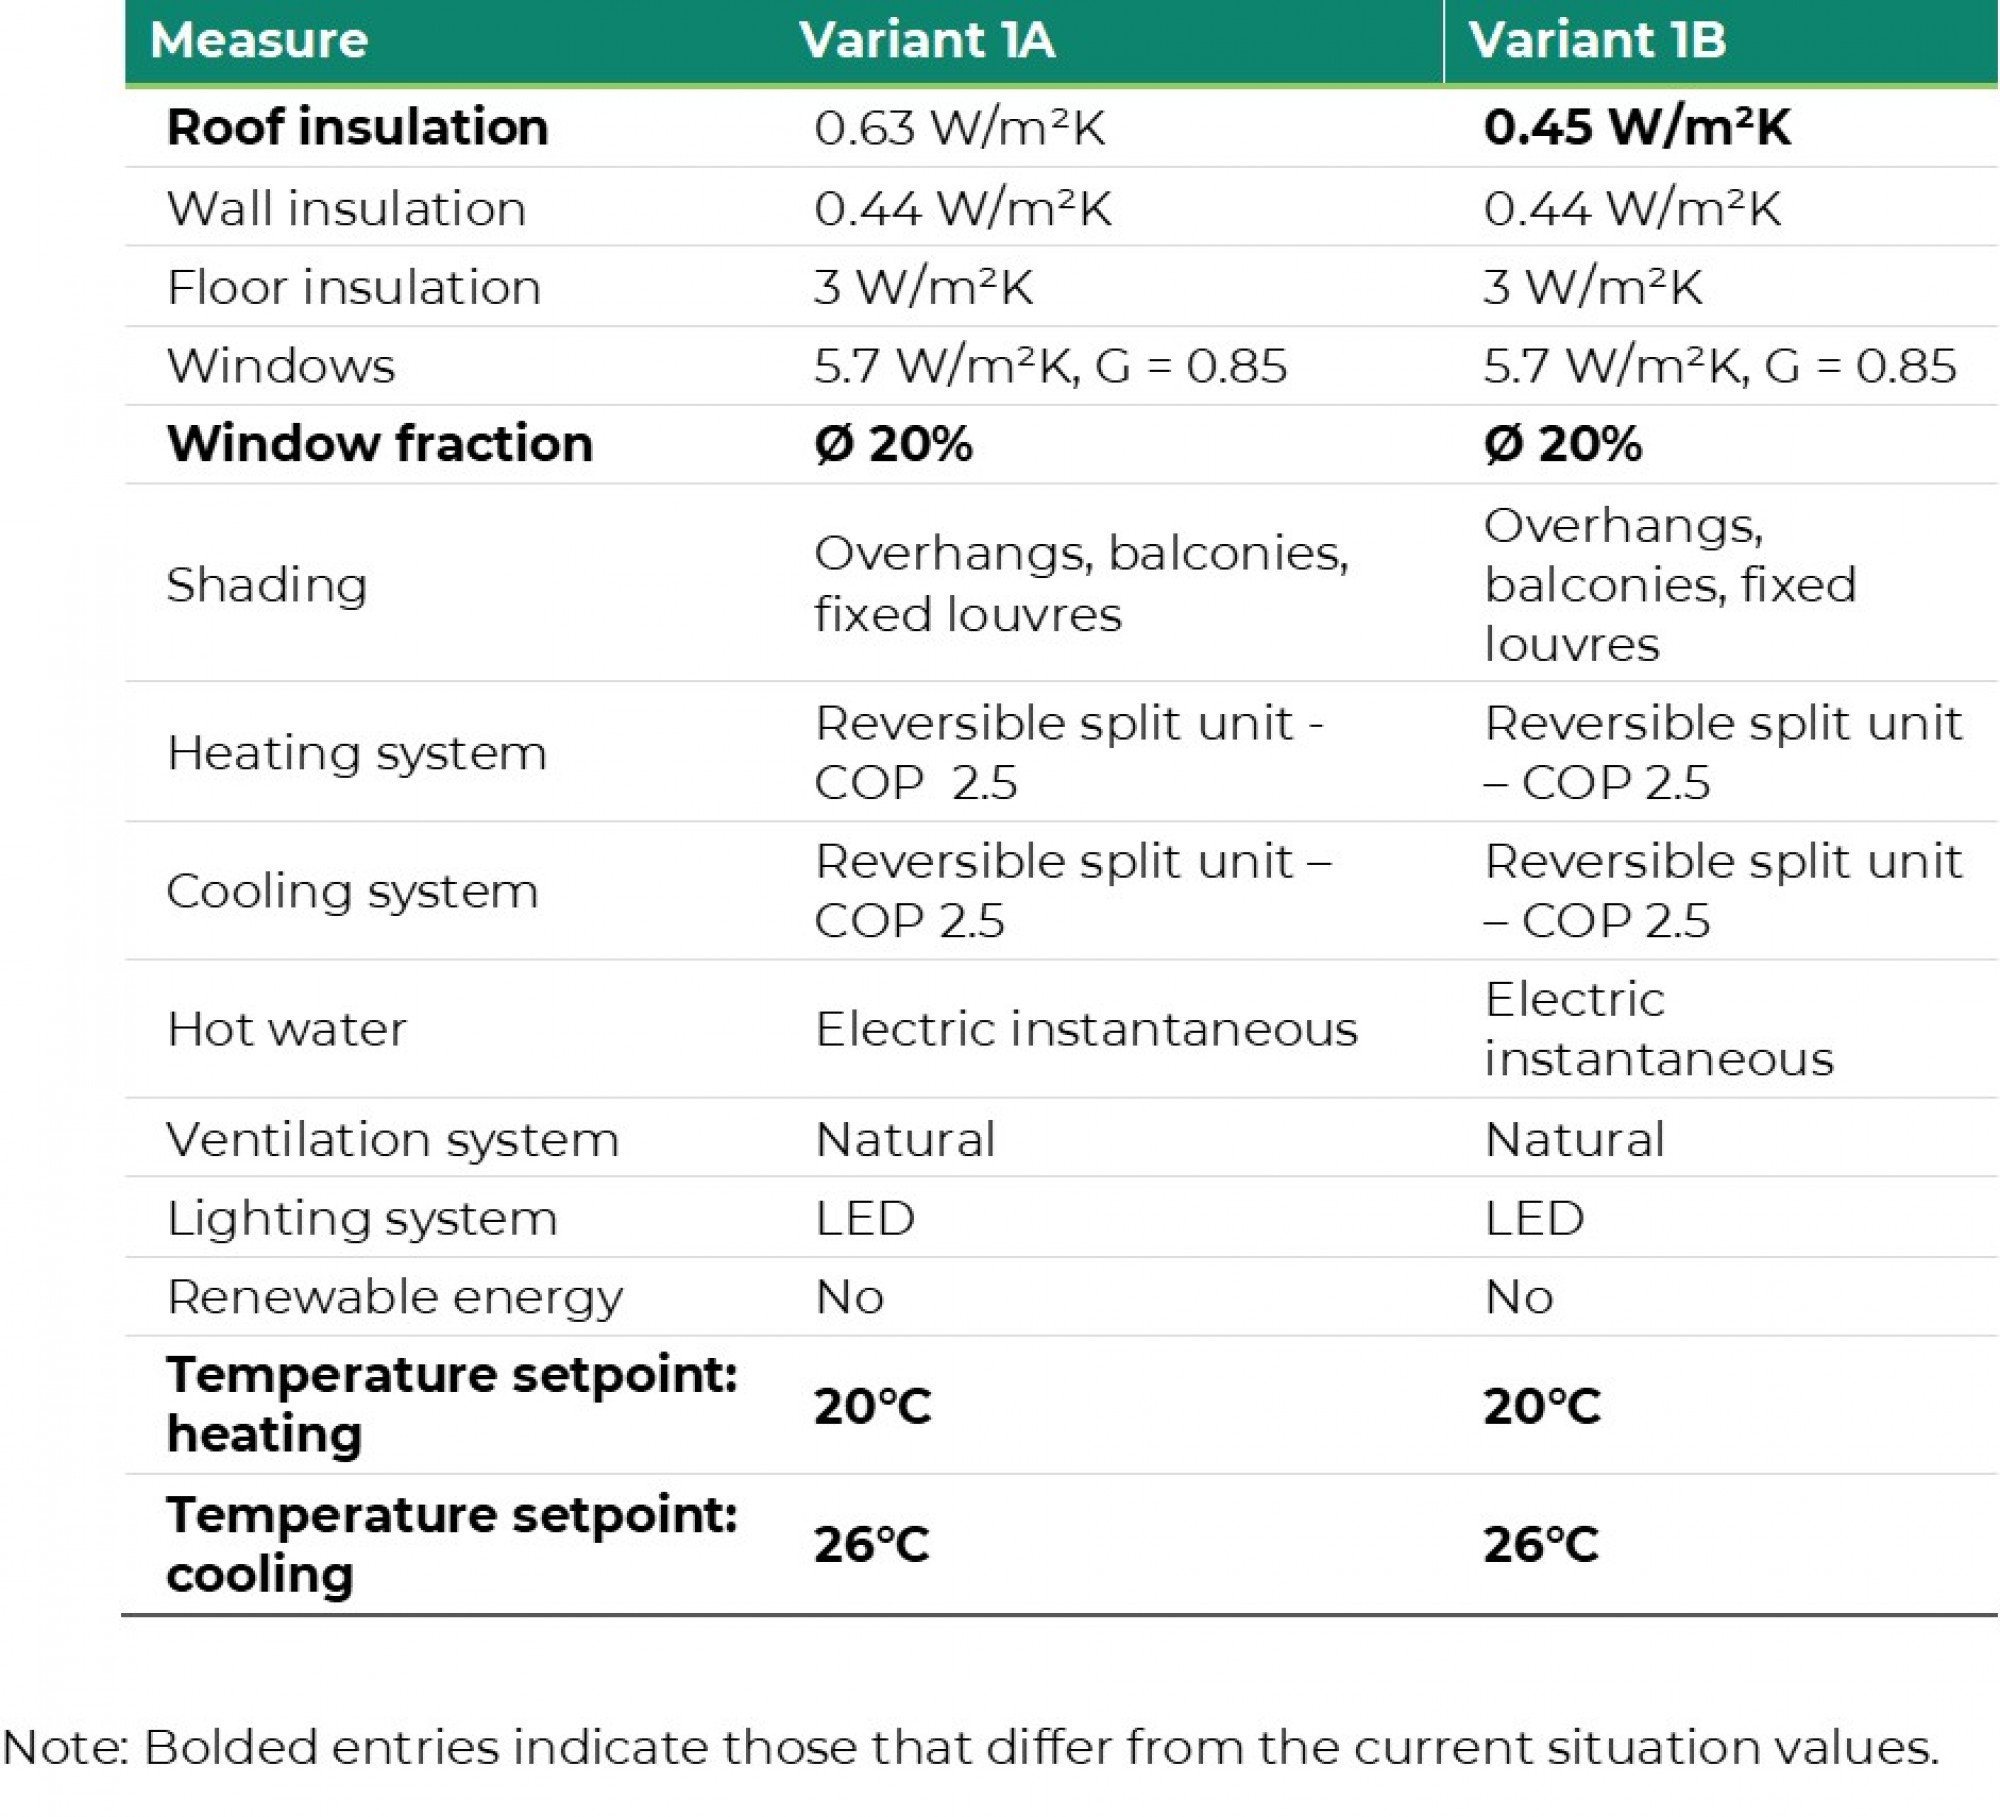
The first variant (low investment) calculates the energy performance of measures with a payback of less than 2 years. Variant 1A considers current energy prices, and variant 1B refers to energy prices without subsidies (high energy prices).
Variant 1A – Low Energy Price
This package differs from the current situation in the following measures: a reduced window fraction of 20% and an appropriate indoor temperature setting that is both energy efficient and respects thermal comfort bands. These low or no cost measures are a response to the available low energy price, which doesn´t justify a high investment in energy efficient measures due to the lack of resulting financial feasibility.
Variant 1B –- High Energy Price
This package, which assumes not subsidised, real energy prices, consists of the following main measure: improved roof insulation compared with Variant 1A.
Technical description – Variant 2
Technical Description – Variant 2A – High End | Low Energy Price
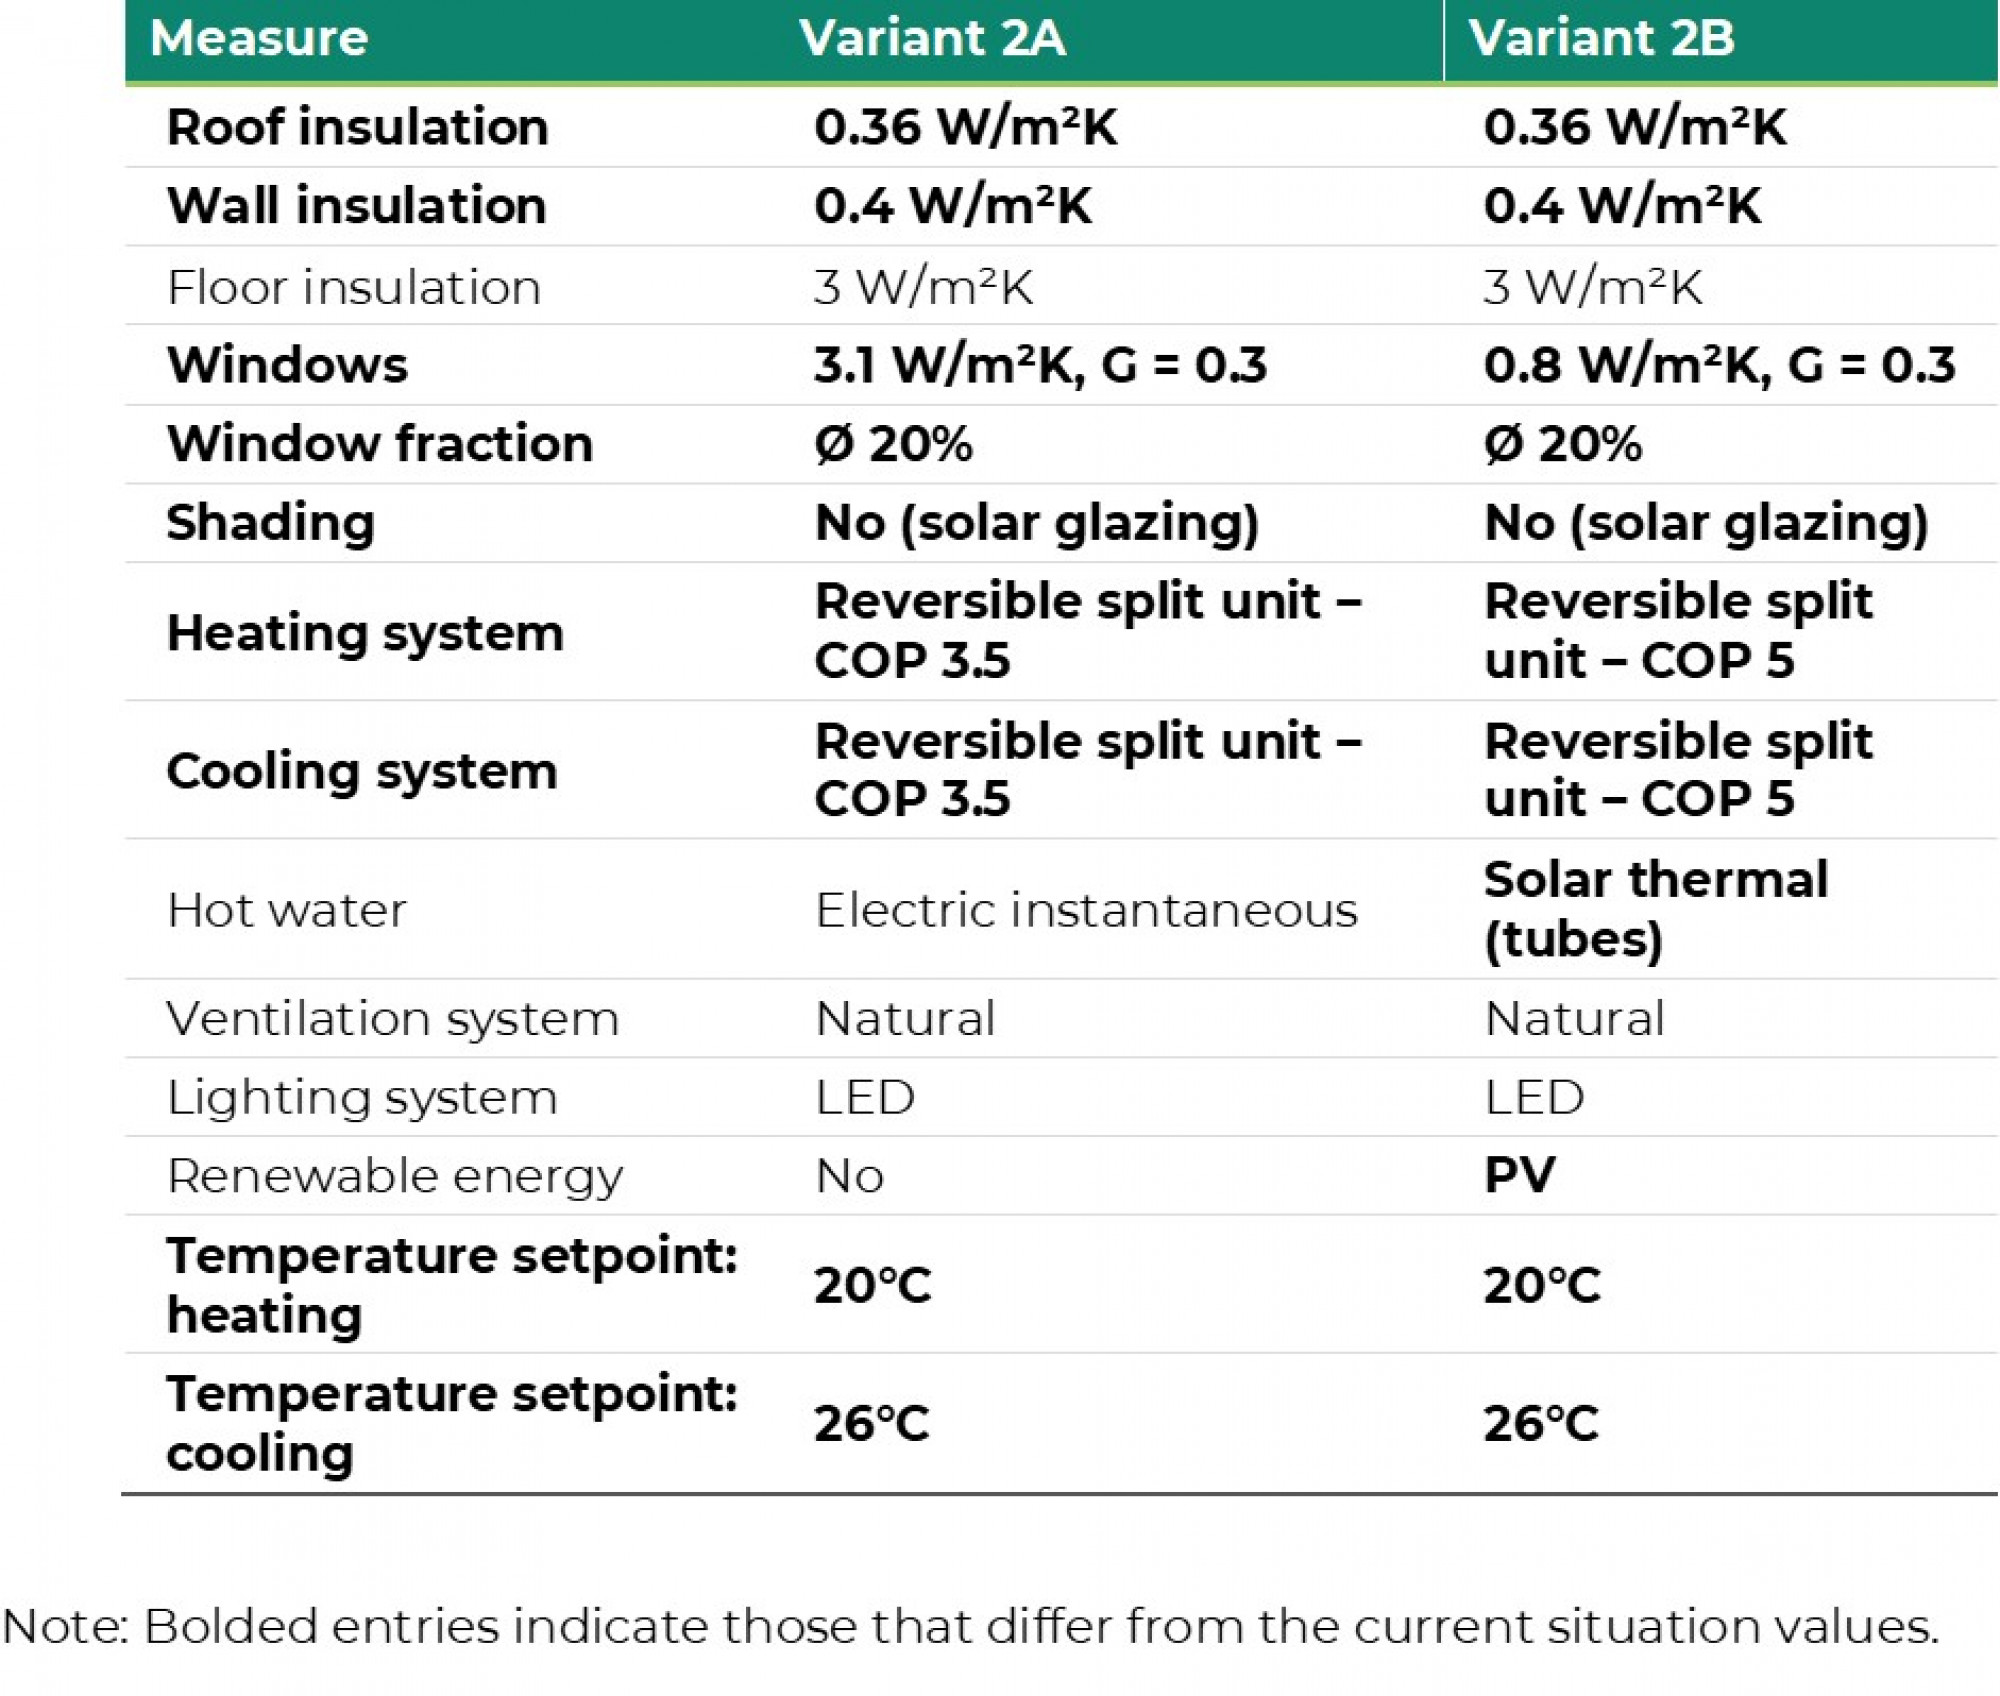
The second variants seek to reduce energy consumption as much as possible, reaching a nearly zero energy level through the integration of renewable energies. At the same time, the financial feasibility of measures must respect a simple formula: payback period smaller than lifetime. This highly energy efficient package consists of the following measures: adjusting set temperatures (20°C for heating, 26°C for cooling), an increased COP of 3.5 for cooling and heating, windows with a U-value of 3.1 W/m²K and a G-value of 0.3, no shading but solar glazing, a 20% window fraction, and further improved U-values for the roof (0.36 W/m²K) and walls (0.4 W/m²K).
Technical Description – Variant 2B – High End | High Energy Price
The second variant that assumes nonsubsidised, real energy prices includes further improved windows with triple glazing (U-value of 0.8 W/m²K) and a G-value of 0.3, an increased COP of 5 for cooling and heating, additional solar thermal tubes for the hot water supply, and the use of PV as a renewable energy source.
Results – Comparative Overview A – Low Energy Prices
The energy consumption decreases by each new introduced variant (from baseline to Variant 2A) by 30%-40% for each step of improvement, resulting in energy consumption savings compared with the baseline of 30% for the current situation, 53% for Variant 1A, and 74% for Variant 2A. The CO2 emissions and energy cost savings follow the same pattern.
The investment costs for the current situation are approximately 20% higher than for the baseline. However, Variant 1A is cheaper than the current situation and offers around 33% energy consumption savings for the allocated measures. This cost savings is the result of a Variant 1A measure that cost less than what was initially planned—specifically, the window fraction reduction results in investment cost savings, as windows are more expensive than external walls.
![Figure 1 Specific final energy demand [kWh/(m²*a)]](https://www.buildings-mena.com/image/1360/14/fig1.png)
![Figure 2 Specific emissions [kg CO2e/(m²*a)]](https://www.buildings-mena.com/image/1360/80/fig2.png)
![Figure 3 Specific energy costs EGP/(m²*a) [EUR/(m²*a)]](https://www.buildings-mena.com/image/1360/a0/fig3.png)
![Figure 4 Specific investment costs EGP/(m²*a [EUR/(m²*a)]]](https://www.buildings-mena.com/image/1360/ba/fig4.png)
Results – Comparative Overview B – High Energy Prices
A scenario that integrates more energy efficiency and renewable energy measures, and considers the nonsubsidised, real energy prices, results in higher energy consumption savings. Compared with the baseline, Variant 1B saved approximately 60% and Variant 2B saved 100%. In terms of investment costs, compared with the baseline, Variant B costs were 20% higher and Variant 2B were roughly 100% higher (the investment costs were twice as high). For Variant 2B, the energy consumption savings are the result of solar energy technologies (solar thermal and PV) that enable the project to reach nearly net-zero energy building (NZEB).
![Figure 5 Specific final energy demand [kWh/(m²*a)]](https://www.buildings-mena.com/image/1360/a2/fig5.png)
![Figure 6 Specific emissions [kg CO2e/(m²*a)]](https://www.buildings-mena.com/image/1360/11/fig6.png)
![Figure 7 Specific energy costs EGP/(m²*a) [EUR/(m²*a)]](https://www.buildings-mena.com/image/1360/ed/fig7.png)
![Figure 8 Specific investment costs EGP/(m²*a [EUR/(m²*a)]]](https://www.buildings-mena.com/image/1360/38/fig8.png)
Recommendation
Two measures should be taken to reduce the energy demand for buildings under construction. First, educate future homeowners about the need to adjust target temperature for cooling and heating(e.g., through flyers and handouts). Second, improve the thermal insulation of the roof, targeting a U-value of 0.45 W/m²K or better.
In addition, future planning should aim to develop zero-energy houses by using highly insulated envelopes, the most energy efficient window fraction (20%), heating and cooling systems with reversible split units with a COP of at least 5, solar thermal hot water systems (vacuum tubes), an optimal proportion of PV, and a target temperature for cooling and heating of 26°C/20°C. To use the solar energy on the roof, an unshaded space towards the south should be reserved for the installation of PV/solar collectors (e.g., when installing water storage tanks, satellite dishes). In addition, local suppliers should demonstrate the cost advantages of PV and solar thermal energy to future homeowners .
Implementation (still to come)
The Porto Pyramid pilot project construction is still not complete (as of September 2019), but the project developer promised to reassess the potential deployment of building envelope measures and their financial feasibility in a more advanced stage. Furthermore, the developer expressed interest in solar PV and behaviour-related measures. The Porto Group claimed to be very satisfied with the technical assistance received in the project and stated interest in further working with Guidehouse in a potential second IKI (International Climate Initiative) project phase. In that case, the dissemination of technical knowledge on energy efficiency measures to managers and engineers should be considered according to the developer.